Identifying key drivers of household consumption rates
- amandathying
- Jan 9, 2025
- 1 min read
The purpose of our project was to identify what are the key drivers that affects household consumption rates among our citizens.
Sidenote: Project was initially done using R which included a shiny app component. But use Python to do the analysis for the purpose of this post.
Our datasets consist of the following variables:


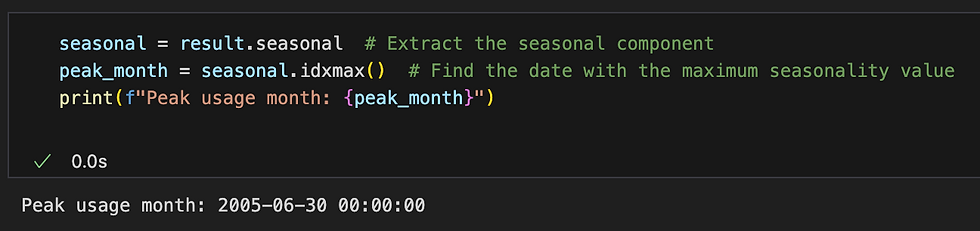
There are clear seasonal trends and the peak month usages is in June. This corresponds with our weather patterns where temperature is warmest in the middle of the year.

We then check for correlations and associations of all the variables with electricity consumptions.

Numerical variables like temperature, wind speed and rainfall are weakly negatively correlated with electricity usage.
For categorical variables, we used ANOVA to measure for significance in variance. We then used Turkey test to measure which planning areas are significantly different from others. The results is that all categorical variables are significant. Specifically, Southern Island, Paya Lebar and Newton have the highest usage. Ang Mo Kio and Hougang have the lowest.
Among the dwelling types, Private Properties have higher usage rate than Public. It is also clear that larger properties tend to have higher usage as well. However, the degree of this usage varies with planning area.

From the heatmap above, you can see that southern island's landed properties have a significantly higher usage than all combinations.
Within Changi area, the 5 room apartments and private apartments/condos also have lower usgaes than the 3 and 1/2 rooms flats in that area.
This suggest that there might be other socioeconomic factors that influences electricity usage.


Comments